
I would like to briefly introduce disconnectivity graphs -- striking visualizations of multidimensional energy landscapes that I had never seen before. While it's not immediately obvious how useful they are, it should be straightforward to adapt them for visualizing probability distributions.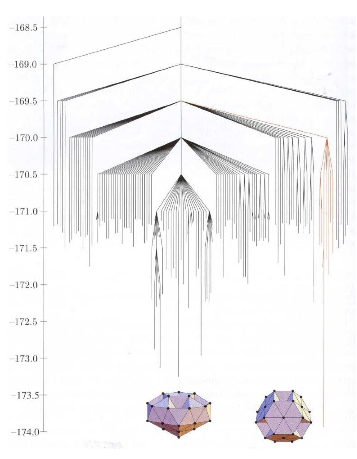
A quick Google search for 'disconnectivity graph' will turn up lots of examples. These things look like chandeliers and are meant to summarize the potential energy surface of a molecule, potentially with many degrees of freedom and many local optima -- think of trying to describe the energies of all of the configurations of a floppy protein or nanodroplet of water. Physicists like David Wales, who gave a talk yesterday on "Exploring Energy Landscapes", use disconnectivity graphs to gain intuition about how (local) minima are connected within such a system and how fast a system will reach the global minimum. You should soon be able to access his talk through the IACS video archive.
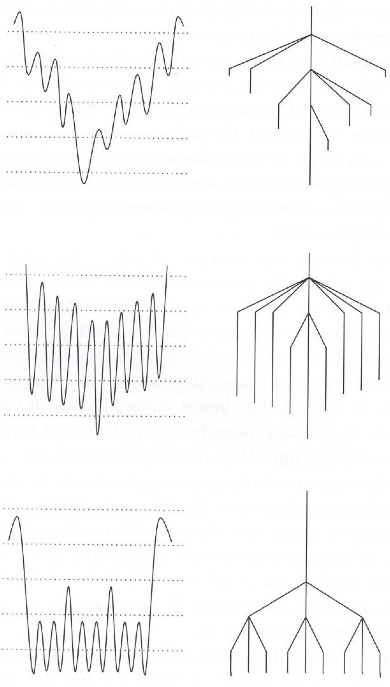
I'll briefly describe how to construct a disconnectivity graph, which should make their interpretation clear. Alternatively, check out this nice summary. The idea is to analyze the landscape with respect to a sequence of energies. Think of a particular energy E as a (hyper)plane slicing through the landscape at a constant height and now flood the landscape from below with water up to this level. Some of the minima are above the water and the rest are partitioned according to separate pools of water. The minima within each pool form 'superbasins' -- sets of minima that are connected by pathways whose energies are below E. A disconnectivity graph is a tree that shows the number of superbasins present at a discrete set of energies (heights) and its branching structure as you move down the graph shows how superbasins at one energy are related to those at the next lower energy. At high enough energies, all the minima are contained in one superbasin (the top of the tree) and the ends of the branches correspond to the energies of the minima. The horizontal spacing of the branching is arbitrary.
For visualizing probability distributions, we basically want to flip the energy analogy upside down since we tend to care about the maxima rather than the minima. An obvious caveat with all of this is that in general, we don't know where all of the optima are! My understanding of what the physicsts do is to use local minimization routines to search for minima and then hope for the best.
Figures from: David J. Wales. Energy landscapes: With applications to clusters, biomolecules and glasses. Cambridge University Press, ISBN 0-521-814157-4, 2003.